Trading Against The Trend
Whether we’re talking about socks or stocks, I like buying quality merchandise when it is marked down.
© Warren Buffett.
If you have experience trading with the trend and you feel confident, then you can try trading against it. In this case, my advice would be to not open an order for a large amount. It is wise to start with coins that have a significant capitalization (BTC or ETH)
Why it is profitable trading against the trend
Trading against the trend has both advantages and disadvantages.
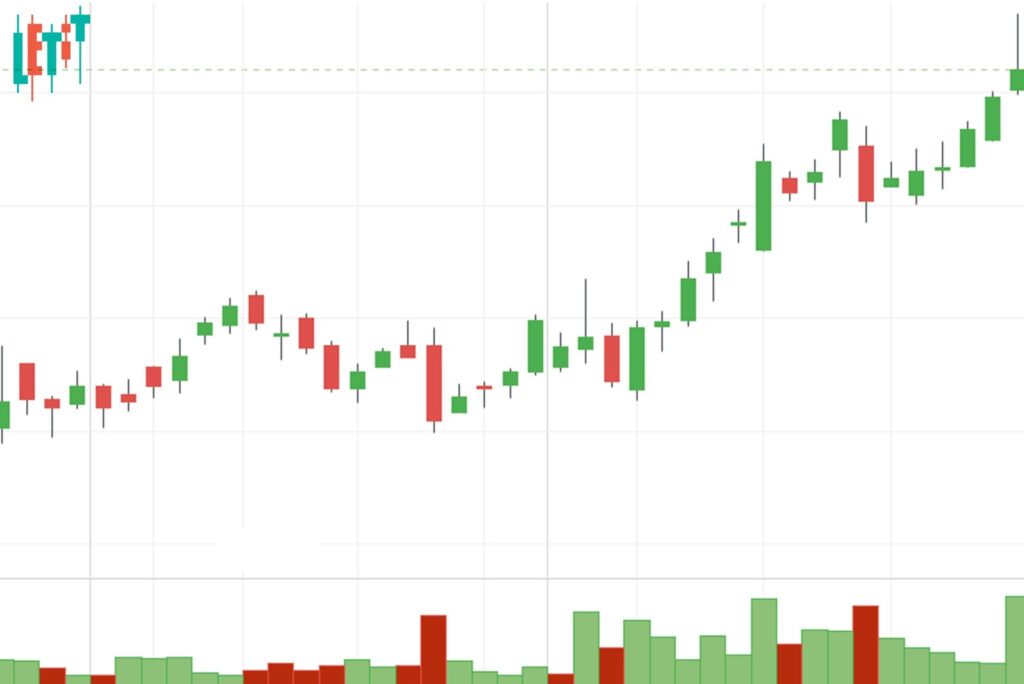
By choosing to not follow the crowd, you get a chance to cash in on the newbies.
More than a half of novice traders drain their deposits in a growing market. And you know why?
Because by trading with the trend, they delay exiting the trade in the hope that the price will grow even more. And on a sharp (sometimes artificially created) turn they are literally robbed blind by experienced players. Greed and carelessness are the cause of most failures. A novice always thinks about possible income and ways to make more, and a trader thinks about how much he can lose.
By trading against the trend, you use a strong momentum to reverse, which will lead to a sharp decline, and then an increase in the price of the cryptocurrency. In this position, you can make a profit twice that of those who go with the trend.
These are the strengths of the trading strategy.
Precautions when trading against the trend
The “meet the price” game is not suitable for beginners, because it requires careful analysis to determine the entry point and attentiveness. And you also need to have a great deal of confidence and courage to place a buy order if the chart shows a bullish pattern.
You should always keep in mind the golden rule: “Do not piss against the wind.” This means that you can trade against the local trend, but always go with the global one. To better understand what local trends are, watch our Elliott Wave tutorial.
First things first, you better assess the state of affairs on a daily or weekly timeframe and only then look for entry points on shorts (for example, on hourly or 30-minute ones). After all, local trends often go in the opposite direction to the global one.
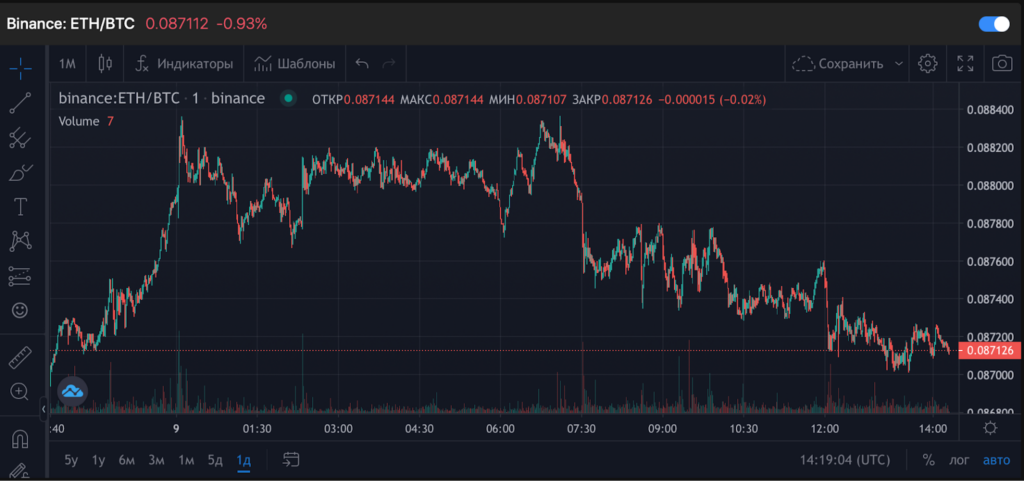
ETH daily global trend
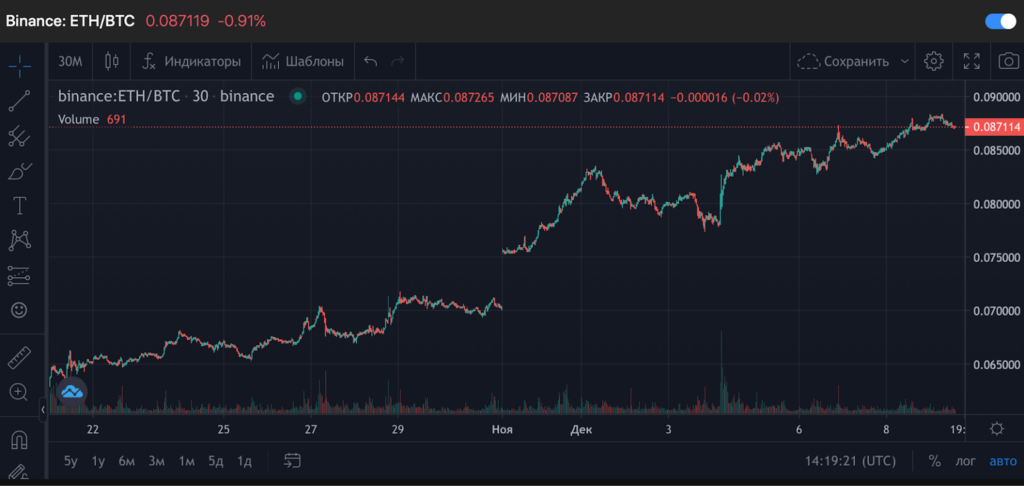
30-minute ETH local trend
If the global trend is up, then you can enter a trade against it on lower timeframes and collect liquidity that inexperienced long traders will provide you when the market knocks out their stops. In this case, you can’t do without a short stop on your part either.
The second rule says: “Don’t go against the trend with large leverage.” This trading strategy is too risky using the exchange’s borrowed funds to play Suicide checkers.
In short timeframes, it’s easy to get in too early and the market will continue to correct, or too late when the correction goes in the opposite direction and you get stopped out. If you are a beginner, leave the options of margin trading for safer trading strategies.
What tools to use to determine entry and exit points
When the trend changes, the chart gives a set of signals that you should focus on when determining the entry point:
- Acceleration. Determined by the increased volume of transactions at the level. This is the point where most members want to buy. After such a climax, the price will be corrected.
- Fading. Decrease in transaction volumes. That is, everyone who wanted to open buy orders has already done so and now one needs to expect a new impulse.
To calculate the level at which it is safe to place orders, use the Bollinger Bands indicator. It indicates the speed of the cryptocurrency price movement and confirms the trend reversal.
These are three bands that are directly laid onto the chart. They show the direction and range of price fluctuations, taking into account market volatility.
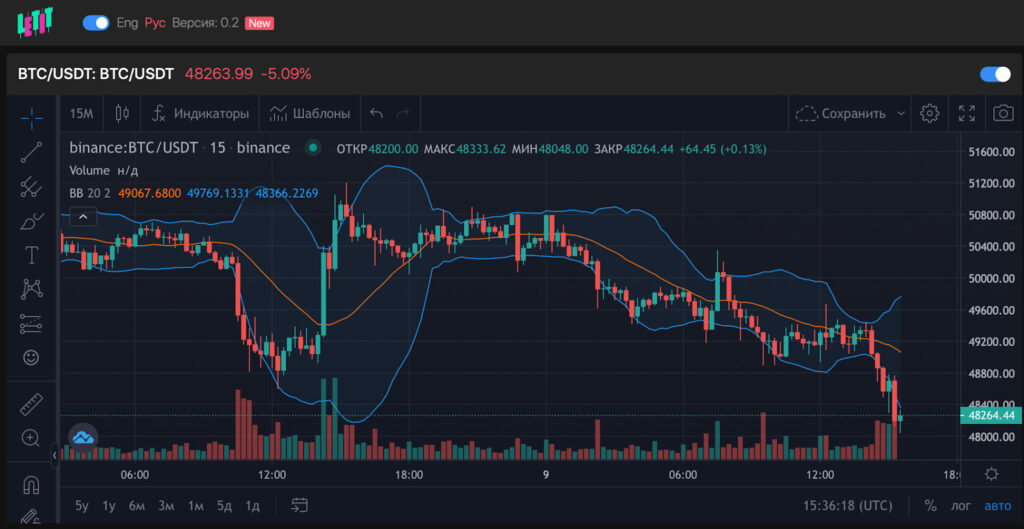
The moving average (red) indicates the price direction. If it goes below the chart, the trend is upward. If higher, vice versa.
Upper and lower (blue) – are indicators of price stability. The greater the distance between them, the more volatile the market is. If these bands diverge, this is a signal for a possible trend change. The narrowing indicates a correction and the upcoming sideways trend.
The impulses that lead to the correction of the local trend occur after the narrowing of the blue bands. These are the levels for opening safe trades.
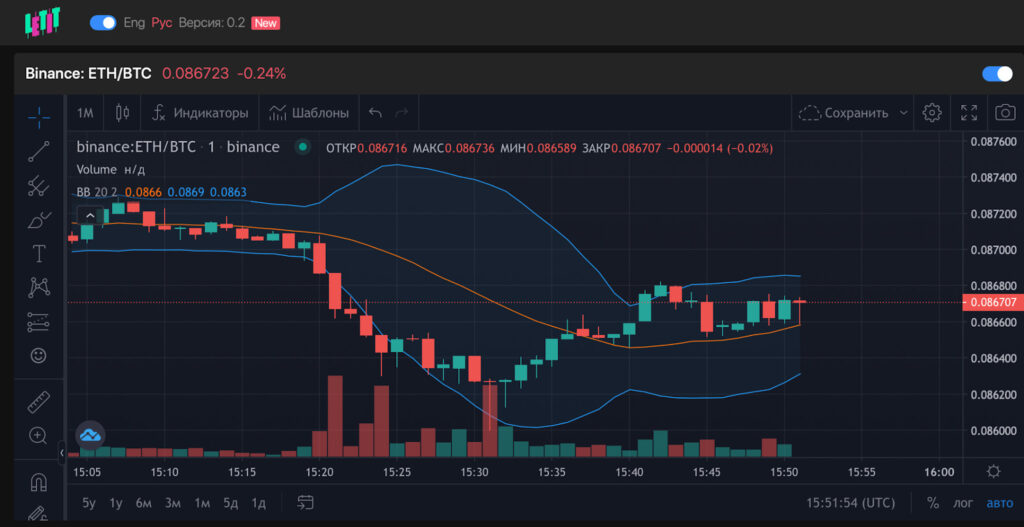
Fading periods are always followed by periods of volatility
The Bollinger indicator does not give an idea about the future direction of the price. It indicates the most favorable entry points. But if during the contraction the candle (or its shadow) breaks through the middle red, its color will indicate a possible trend – bullish or bearish.
 Join our Linkedin channel to stay updated on the latest news!
Subscribe

