Up Bar
The Bar indicator widely accepted in Europe differs from traditional Japanese candlesticks only in its style.
Bars, just like candlesticks, are divided into two types: bullish (up bar) and bearish (down bar).
The candlestick is perceived more easily on the chart due to the volumetric visualization of its body, and yet some traders prefer to work with bars only.
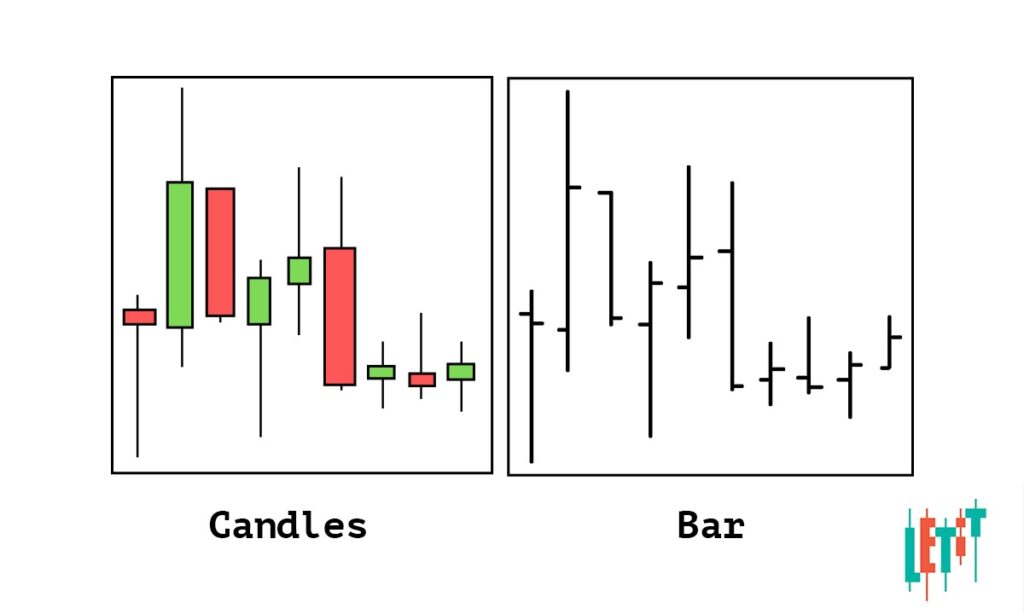
Up-bar is an indicator of the price growth on the stock chart. It is defined as bullish if its closing price is higher than the one from the previous bar.
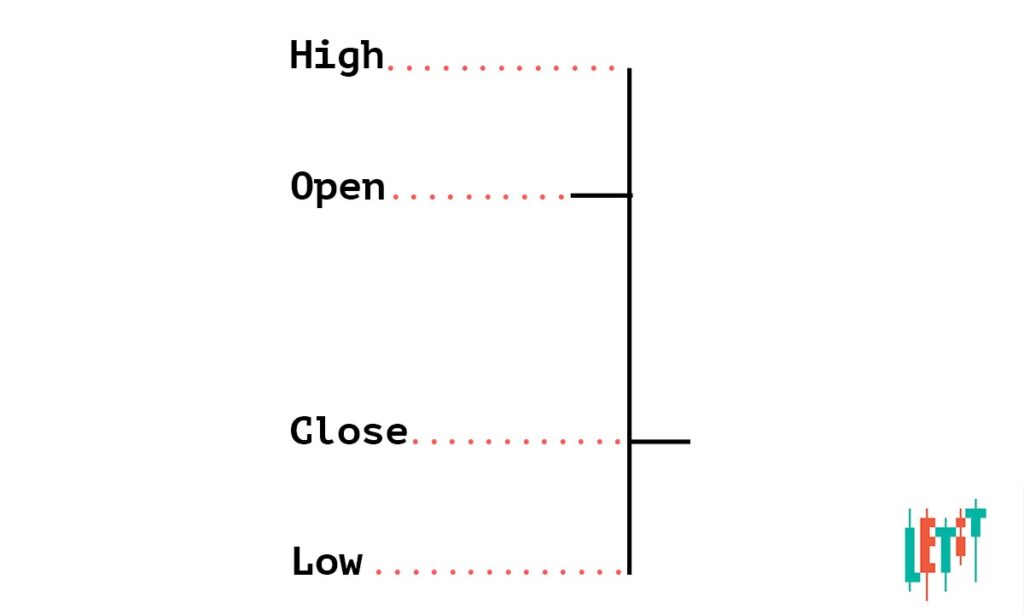
You may also come across the definition of “upward bar” online. Such an indicator has a closing price higher than the opening price, and, unlike an up-bar, it does not give an idea of the strength of the market.
An up bar with a characteristic wide average spread indicates the presence of bulls. If the price is being closed in the upper third of the up-bar, it is a signal that the bullish breakout is strong and it may go on.


