Elliott Wave Theory
Wave patterns of price movement in the market were described in 1938 by Ralph Nelson Elliott. Therefore, they are called “Elliot waves”.
Elliott has been monitoring the stock indexes for several years. The observations turned out to be so true that over time they turned into a tool for technical analysis. Now the Elliott Wave indicators are used to determine the direction of price movement.
Elliott Wave rules and patterns
Elliott Wave Theory proves that the price movement of any liquid asset can be divided into several segments. They sequentially connect the minimum and maximum price values. These segments are called waves or impulses. And they are connected with the psychological component of trading participants – bulls and bears.
According to the Theory impulse waves are formed in the direction of the current trend. And corrective waves go in the opposite direction.
Impulse Elliott Waves move the price up or down, while corrective waves bring down this movement.
Elliott believed (there is a practical confirmation) that there are always three impulse waves for two corrective waves.
That is, any trend consists of five segments of the impulse. And after the final, fifth, there always follows a general correction for the entire impulse within the trend direction. This correction consists of three Elliott waves. If its lower level crosses the boundaries of the first segment, this is a signal to change the direction of price movement.
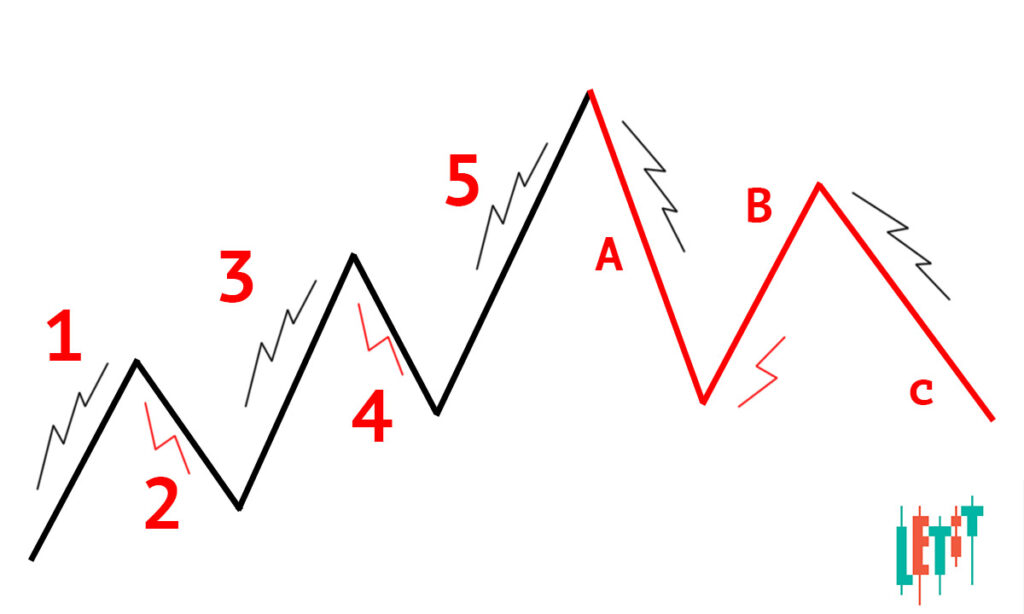
In other words, for 3 “bears” there are always 2 “bulls” and vice versa. (This does not exclude that after the change of direction they will switch roles, keeping the proportion 3/2)
The Elliott Wave indicators clearly confirm that there are always two bearish corrections in a bull market. On the bearish – two corrections from the bulls.
Elliott wave theory has revealed several patterns:
- impulse wave 0-1 is always longer than corrective wave 1-2;
- of all the segments, the longest is always 2-3, so trading on it brings the greatest profit if you set a Buy stop;
- segment 3-4 (corrective) almost never goes beyond the upper boundaries of the first;
- the safest trading pattern is on the 4-5 segment, because the price reverses on it 95 times out of 100.
How to use Elliott Waves in trading
You can use the features of the Elliott Wave indicators in cryptocurrency trading when looking for an entry point into a position.
For Example:
- If the second correction segment (1-2) forms an acute angle, then the second correction (3-4) will be smooth. The more powerful the first correction, the weaker the second one.
- When the final impulse (5-A-B-C) knocks down the price growth by 5-14%, then we are dealing with a general price correction for the asset. It is the balancing of supply and demand.
This explanation would have been sufficient, but it is not as simple as it seems. The peculiarity of the Elliott wave, the impulse one, is that it consists of smaller fluctuations. At the same time, they have the same structure of five waves as the main one.
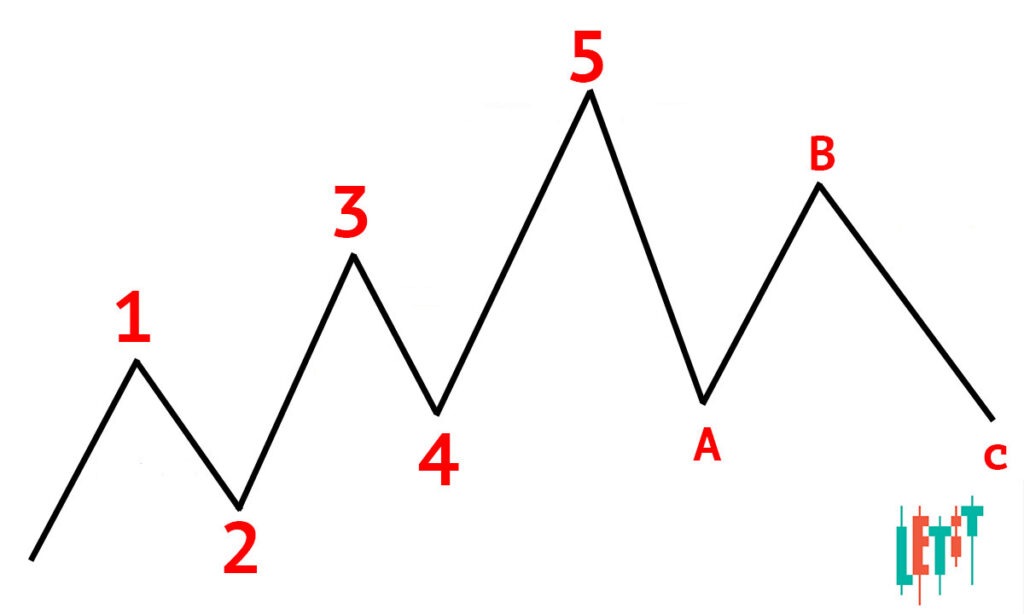
That is, the structure of one trend-forming impulse also looks like five segments (three impulse and two corrective), and the structure of the corrective one – in the form of three segments (two impulse and one corrective)
Therefore, due to the complex structure of the price movement, it is not always easy to determine the beginning and end of a trend. Especially, when we look at the short timeframe of alternating red and green candlesticks. It is almost impossible to understand which segments are part of the Elliott wave that sets a trend, and which are corrective ones.


